

EPS and P/E ratios are relatively well-known metrics, and are widely used by analysts and investors when analyzing companies. Unfortunately, both ratios have numerous pitfalls that can often trap unsuspecting and unwary investors. First, let's look at what exactly these two ratios show, and then I'll use examples to illustrate why they are problematic.
📘What is EPS? EPS Meaning
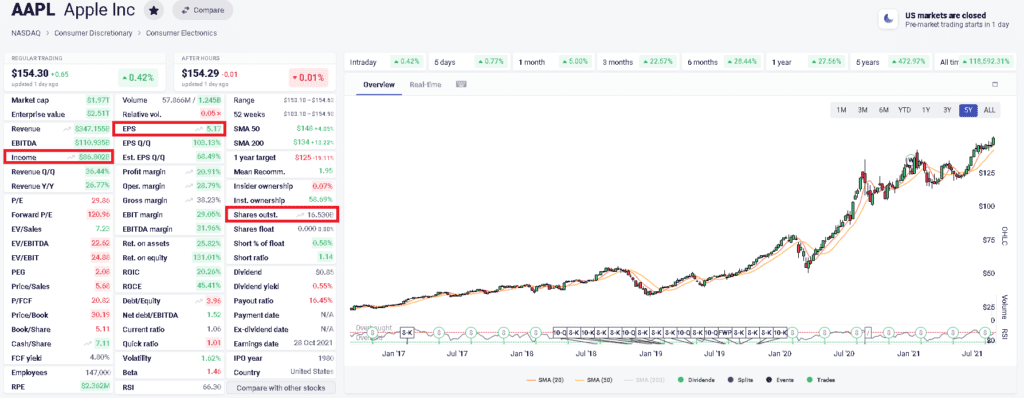
💡EPS stands for "earnings per share". It simply means after-tax profit per share, which means you divide the profit by the number of shares.
Investors and analysts like to use this metric because it is one of the indicators that everyone follows very closely. Analyses are based on it, and it is relatively easy to read the essence from it. However, it is very important that you should not draw any far-reaching conclusions from earnings per share alone, but it is worth following the quarterly trend. If it is steadily increasing, then it is usually considered a positive sign.
Since the stock market is like a voting machine in the short term, as Benjamin Graham said, a rapid increase in EPS usually increases the stock price. However, this is usually an overreaction based on a single quarterly report. The other important thing about EPS is that analysts often formulate their expectations, or rather their forecasts, which is a guess, in relation to the EPS indicator.
📊The relationship between stock price and earnings
From the above, it is relatively easy to conclude that if EPS increases or if results are better than experts/analysts' expectations, the share price often increases. This is simply based on the fact that if a company is able to generate higher profits overall in the long term, this is an increase in EPS, then its value has increased, which means that this should also be reflected in the share price. This does not necessarily remain in the form of profit, but is invested by the company in other value-creating things. For example, it buys back its own shares, pays dividends, makes investments, etc.
Of course, the opposite is also true, if EPS decreases, then there is a good chance that the share price will also decrease, meaning that the company's lower profit-making ability must be reflected in the share price, necessarily reducing the value of the shares. So this is the basic idea, let's see how EPS should be calculated.
🧮Calculating EPS indicator
Not everyone needs to calculate EPS, as there is no data sorting program, site, or database that does not list it. However, if you still want to do so for some reason, for example to check the data on sites, you need to know two things:
- 🧩The company's profit for the given quarter
- 🧩the number of shares
The two numbers need to be divided by each other. So, if the quarterly profit is $10 billion and the company has 5 billion shares outstanding, then the earnings per share will be $2. So, EPS= earnings/share, the profit divided by the number of shares, so it's not a big math puzzle you have to solve.

🎯P/E ratio meaning
💡P/E ratio is nothing more than price divided by EPS. In other words, the ratio also expresses relative valuation; if the P/E is low, the company seems cheap.
This is related to the Graham number used by Benjamin Graham, which takes the P/E and P/B values as a basis. He set the P/E maximum at 15 and the P/B ratio at 1.5. Many people have concluded from this that companies with a P/E value lower than 15 are considered cheap, while those with a higher P/E value are considered more expensive. In other words, the P/E shows how the company is valued. This is of course a strong exaggeration, but it can also be used as a starting point if you want to quickly draw conclusions about a company's valuation. We also use the Petery Lynch P/E value in our stock analyses, and you can access it here: iO Charts stock analyses
📘What is the P/E ratio, how does it differ from EPS?
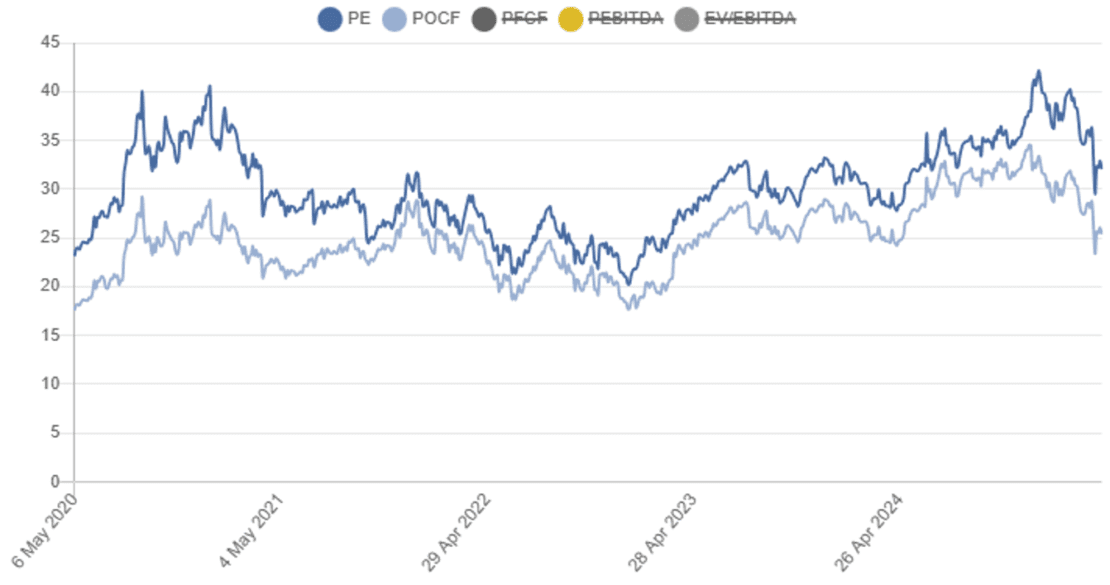
From the above, it is clear that the difference between the two ratios is simply that P/E also takes into account the share price, while EPS only deals with earnings. In both cases, the key is to pay attention to the trend, not the specific number. The best way to check this is to look at historical data for both EPS and P/E ratios on sites like iO Charts. We have a historical graph available for this, where you can easily see this.

🧮Calculating P/E ratio
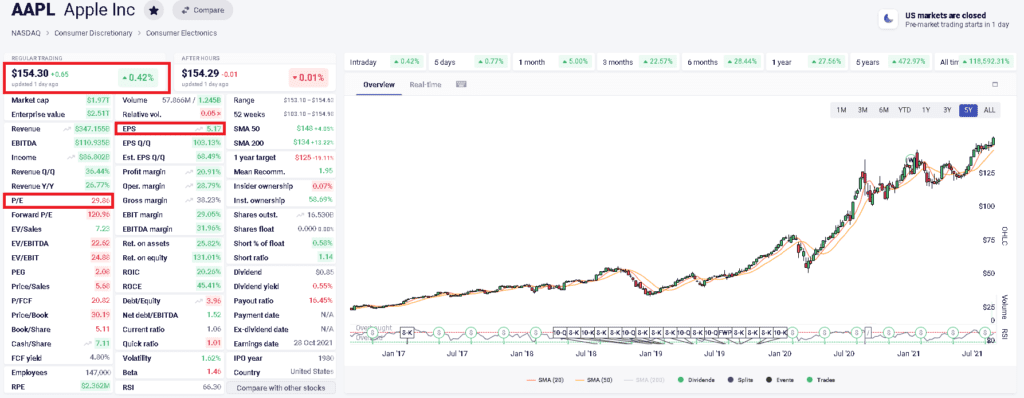
Of course, you don't have to calculate this ratio, as it can be found on every screener site. If you insist on it, you have to divide the share price by the earnings per share. That is, P/E = share price/(earnings/number of shares). That's all, but no one calculates these, they just look them up on some site.
🧾P/E and EPS ratio pitfalls
I admit, I very rarely use the above indicators, simply because they are capable of terrible distortions, of which I will show an example.
The first thing is that the P/E ratio itself doesn't mean much! After all, what is the average of the index belonging to a given stock market, say the S&P 500? And within that, what is the average of the given company's sector? The P/E value of a utility company is almost without exception lower than that of a company belonging to the tech sector. If the market is expensive, the P/E values also creep up, and if it is falling, then they creep down. So, for this reason alone, it is not possible to clearly state whether something is a bargain or too expensive to buy at a given moment. You always need to find some reference point to which you compare the given prices. The best model for this is probably Chuck Carnevale's Fastgraphs (Fastgraphs), where the chart shows multiple P/E values. However, we will now take a closer look at why you can get trapped with the P/E or EPS ratio.
P/E is nothing more than two numbers, the price divided by the earnings per share. This means that the ratio can be lower even if the price falls or EPS increases. Let's look at a simple example: Company X's stock price is $100 and its EPS is $10, so the P/E is 10. This seems cheap, the industry average is 15, but it's not clear whether the price is low or the EPS is high. Let's say the price drops 30%, so it only costs $70. Since the number in the numerator has decreased by 30%, the value after the division will also be less by that much, so the P/E will be 7. The same thing would happen if the earnings per share increased by 40%, to $14, and the P/E value would still be 7. Are the two the same? No, so you have to be able to decide what makes the P/E value the value it is.

📉What EPS and P/E show: underpricing, risk, fundamental problems
The biggest problem with P/E is that it is impossible to tell at a glance why it is the way it is. There are countless reasons why it may rise or fall, the most common of which are:
- 🤔political tailwind or headwind
- 🤔Market panic or mania
- 🤔damage or strengthening of foundations
- 🤔some market inequality occurs
I will show you examples of each to help you understand why the P/E ratio is misleading.
⚖️Political tailwind or headwind
I think everyone knows Alibaba (BABA), one of the most important Chinese companies, whose share price was slashed in 2022, while its real value was reportedly somewhere around 300 USD (Morning Star). This indicates a roughly 50% undervaluation, expressed in terms of a forward P/E number of 17.36. This would be a P/E of 33.6 at fair value. To determine whether this is high or low, we need to know two things: one, what the industry average is. In 2022, I made a pilgrimage to the Simply Wall St. site (Simply Wall St.) and I looked at it, it showed P/E=27.6 and it sees the stock as undervalued by about 40%. Oops, then the fundamentals must be damaged, let's check it out according to the 2022 data:
- 📊Revenue: 31.6 billion USD, +34%
- 📊Number of annual users: 1.18 billion people, +3.9%
- 📊operating revenue: $4.8 billion, -11% (received a one-time $2.8 billion fine)
- 📊Profit: 6.9 billion USD, +10%
- 📊Diluted EPS: 22.7 USD, +12%
- 📊P/E: 17.36
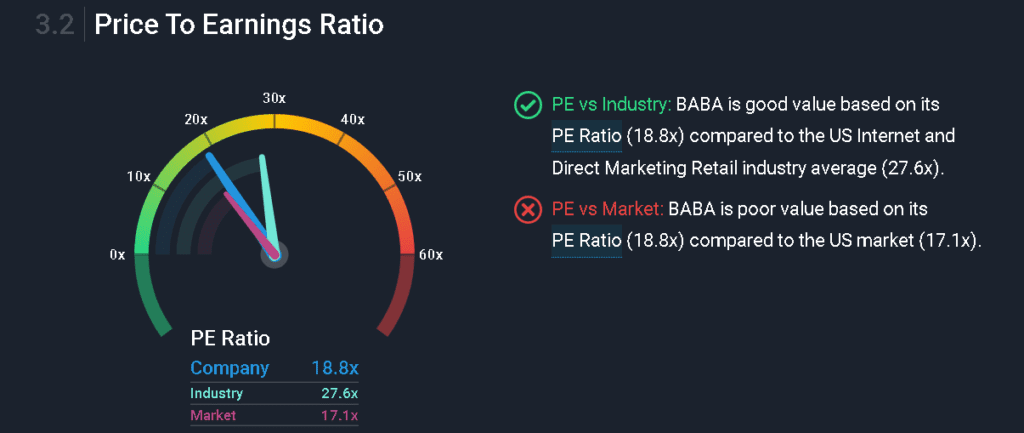
Not only are the fundamentals not damaged, but they have improved, so what could be the problem? The operating income line already suggests that there is some regulatory risk here. The Chinese state has been cracking down on companies, and other risks have arisen, ADR, FRI etc., which caused the share price to plummet. The bottom line is that the lower P/E was due to political headwinds in 2022, not problems in the company's operations.
🎯This is what happened since then: A lot has changed since then, including Alibaba (BABA) EPS and P/E values. The fundamentals eventually followed the price drop at that time, and the stock is currently trading at a P/E of 16.1, with an EPS of 53.6 USD. So, even though the share price is higher in July 2025 than 3 years earlier, the stock is still trading at a lower P/E three years later due to the EPS growth.
😱Market panic or mania
The former could be a perfect example of market panic, but there is a huge external influence that moves prices. In March 2020, during the market crash mentioned in connection with the COVID pandemic, the price of oil was negative for a short time, and the prices of all oil companies fell sharply. Obviously, this still means that gasoline and diesel cars will still have to be refueled tomorrow, and ships and planes will still operate somehow, so there was a very brutal underpricing in the segment. I have also written two articles about oil companies (oil sector articles), and at the time of the crash, there was no apparent fundamental reason for the fall in stock prices. It took 1-2 quarters for it to become apparent, but then the problems in the fundamentals became apparent and the market priced this in.
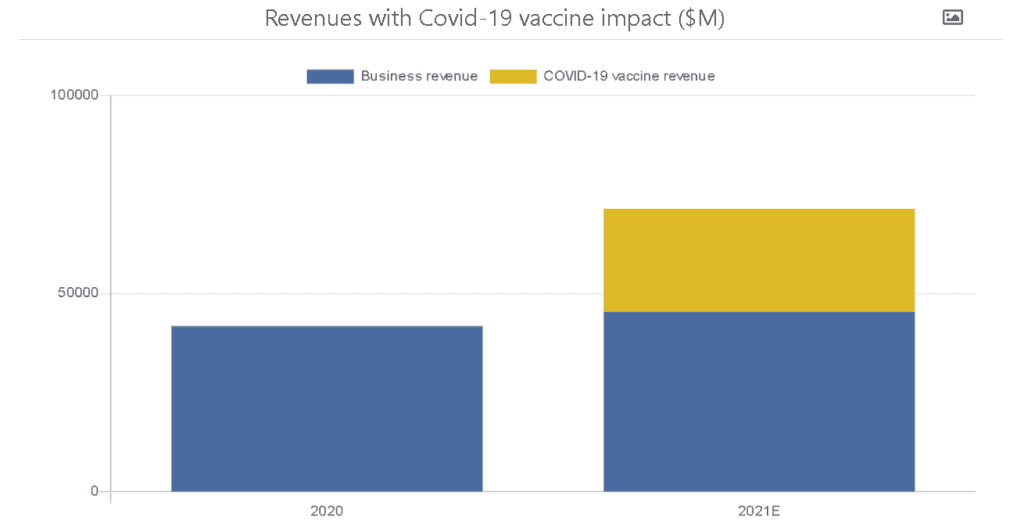
A counterexample is all the vaccine companies. The moment it was revealed in 2021 that Moderna (mRNA) will be able to produce a vaccine, its price skyrocketed. It jumped from 20-30 USD to over 400 USD, a twenty-fold increase. The same was true for Pfizer (Pfe) also jumped from around 33 USD to 50, for similar reasons. Of course, in January they still communicated that vaccines are a break-even business, that they are only doing it for the prestige. We made a graph so that you can see how much additional revenue Pfizer has generated from vaccines. As you can see, there was a reason for the hype here too. They priced in the expected fundamental improvements in advance, which was reflected in the increased P/E of 28.
🚨Damage or strengthening of foundations
You've probably heard of meme stocks. Typical representatives of this category are Gamestop (GME) or PetMed Express (PETS), which will be discussed now. If you look at the price of PetMed Express in 2021, there are two pretty rough bounces from the usual price range of 25-30 USD, which are the result of the so-called “short squeeze”. The essence of this is that small investors band together to drive up the price so that large funds that are shorting the stock have to close their positions, thereby preventing the loss of even more money. So, here you can see the result of a kind of mania in the price. Why did I bring this up in the section on the damage or strengthening of fundamentals? Because in the meantime, PETS's last quarter was quite bad, their revenues fell by about 43%, which was followed by the price. In other words, there is clearly a fundamental reason why the big funds started shorting the company, and a mania went against this, and the two things merged. I highlighted a few dates in the price that may be interesting:
- 2021.01.27: price maximum 57.05 USD, P/E=33.64, EPS=1.54
- 2021.06.03: price maximum 46.58 USD P/E=30.10, EPS=1.53
------------------------
- 2021.07.26: minimum price 24.67 USD P/E=20.75, EPS=1.36
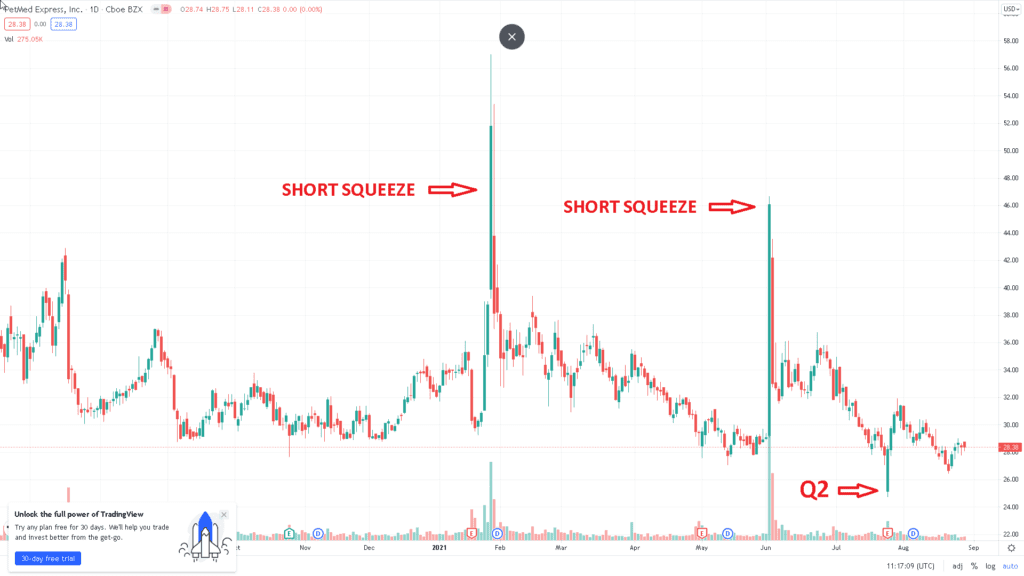
Since one of the elements of the P/E component is price, it is clear from the above figures at first glance that the difference between the two extreme values is quite large. If I draw a line under the second line, the effect of the price fluctuations caused by the mania and the effect of financial funds “countershorting” due to fundamentals are clearly separated. In the first two cases, the P/E change was induced not by the EPS movement, but by the price change. In the second case, the EPS drop was followed by the stock price, resulting in a much more probable P/E number than during the mania.
⚖️Some kind of imparity, market inequality occurs
💡Market inequalities usually create opportunities for arbitrage. We call it risk-free returns, but in the era of high-frequency trading, there are not many of these in the market.
The reason for this is that investors immediately react to the differences, so it cannot develop. However, I recently came across a rather timely example, when AMD (AMD) announced in October 2020 that it would acquire a company called Xilinx (XLNX) by the end of 2021. Normally, acquisitions are completed with cash – or the necessary credit – for example, if company X buys company Y for 50 USD, then company Y's share price will increase from 40 to 50, so the exchange rates are correlated with the amount paid by company X.
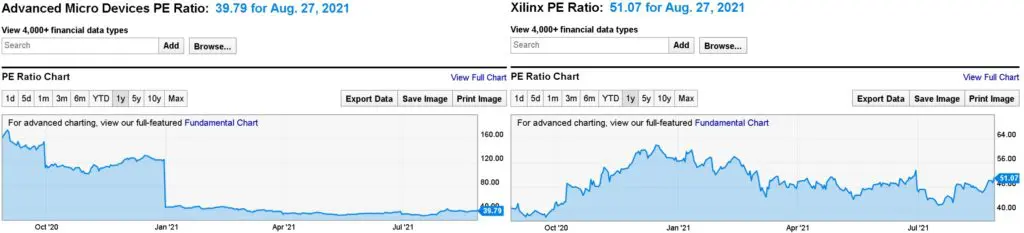
However, the AMD acquisition is called “all stock deal”, meaning that when the companies merge, Xilinx shareholders will receive AMD shares, based on a specific ratio, in this case 1 Xilinx is worth 1.7234 AMD. In other words, if the hypothetical acquisition takes place, 1 Xilinx share worth 100 USD will be exchanged for 1.7324 AMD shares, which should be worth 172.34 USD. Obviously, it won't be exactly that much, and that's the point. If for some reason AMD and Xilinx shares do not move together, e.g. Xilinx is cheaper compared to its fair value, then it is logical to profit by buying Xilinx shares, which will then be converted to AMD. Since the price is part of the P/E ratio, these types of price increases cannot be attributed to fundamental reasons either; the announcement simply raises the price of the shares and that's it.
EPS summary
To summarize the above, P/E and EPS ratios are good for many things, but you should always read what news has been published about a company. It is not unimportant why these metrics are the way they are. It is also possible that these numbers are not real, underlying values, panic or mania are driving them, but it could also be completely well-founded economic performance. That is why far-reaching conclusions about a stock should not be drawn from these indicators. They don't mean anything by themselves, and it's always worth using a reference point to interpret them against. This could be the market, i.e. the index, or an industry average, but these can only serve as an approximation of the true value of a company. Determining company value is one of the most difficult things, so you should not draw conclusions superficially, especially not from simpler metrics like P/E or EPS.
🤑If you are interested in what brokers we use, read our articles below:
(I.e.Interactive Brokers broker account analysis – Professional for professionals
📈LightYear Broker Account Analysis - Simplicity and cheapness go hand in hand
Frequently Asked Questions (FAQ)
Which broker should I choose to buy shares?
There are several aspects to consider when choosing a broker - we will write a complete article about this - but here are some aspects worth considering:
- size, reliability: The bigger a broker, the safer it is. Those with a banking background – Erste, K&H, Charles Schwab, etc. – are even better, and well-known brokers are typically more reliable.
- expenditures: Brokers charge a variety of costs, including account management fees, portfolio fees – which are the worst costs –, purchase/sale fees and currency exchange costs (if you have not deposited USD in your brokerage account).
- Availability of instruments: It doesn't matter which broker has which market available, or whether they add the given instrument upon request and how quickly.
- account type: cash or margin account, the latter can only be used for options. For Hungarian tax residents, having a TBSZ account is important, but citizens of other countries also have special options – such as the American 401K retirement savings account – which are either supported by the broker or not.
- surface: is one of the most underrated aspects, and it can be a real pain. Anyone who has had an account with Random Capital knows what it was like to use an interface that was reminiscent of the 90s. Erste's interface is horribly slow, Interactive Brokers is horribly complicated but good for a lot of things, while LightYear believes in simple solutions dressed up in a modern way.
Based on the above, I recommend the Interactive Brokers account because:
- the world's largest broker with a strong background
- There are a few million instruments available on it, and often instruments listed on multiple markets for a single share – e.g. both the original and the ADR – are also available.
- Interactive Brokers a discount broker, they have the lowest prices on the market
- you can link your Wise account to them, from which you can quickly transfer money
- Morning Star's analyses are available for free under fundamental explorer (good for analysis)
- EVA framework data is available under fundamental explorer (useful for analysis)
- they have both cash and margin accounts, Hungarian citizens can open a TBSZ account
- you can use three types of interfaces: there is a web and PC client and a phone application
What data sources did you use to analyze stocks?
For quantitative analysis, we primarily use various stock screening sites, and for qualitative analysis, we use company reports and other analyses, such as the Substack channel, podcasts - Business Breakdowns - and similar sources.
What matters: value or quality?
The answer is both, but quality is more important. It is much better to buy a very high-quality company at a fair price than to buy shares of a cheap but poor-quality company.
What is the best time frame to buy shares?
The minimum is 5 years, but you should consider the time horizon from 10 years to infinity. Our approach is typical "buy and hold", the emphasis is on selection, then we try to hold the shares for as long as possible, which requires conviction. We rarely sell, mainly if we feel that the thesis we set up has been broken or if we have made a mistake.
Which is better: individual stocks or ETFs?
There is no truth to this question. It is very easy to track the market with an S&P 500 ETF, and it is worth doing for beginners, because it can be done with a little knowledge and practice. Analyzing individual stocks requires 30-50 hours per company, so we do not recommend it to those who do not like it.
Do you hold the shares in a TBSZ account?
Why don't you set a buy price for the shares in your analyses?
We do not set purchase prices for several reasons: firstly, because it is impossible to calculate the exact value of a company. Secondly, because we cannot give investment advice, these analyses are only made to support the decisions of others. That is why we use fair value estimates from other services, as well as a certain margin of safety. Ultimately, your conviction will decide how much a company is worth to you.
Which stock price will rise or fall?
Nobody knows, because there is no magic bullet that can tell. It can be based on mathematical probabilities. The prices of high-quality companies that have growing sales, are able to reinvest the cash generated into the business, and have high intrinsic value creation tend to rise in the long term. But in the short term – a few years – the market and the price can move anywhere.
Legal and liability statement (aka. disclaimer): my articles contain personal opinions, I write them solely for my own entertainment and that of my readers, so the articles published on iO Charts do NOT in any way exhaust the scope of investment advice. I have never wanted, do not want and am unlikely to give such advice in the future, what is written here can only be considered informational content and cannot be interpreted as an offer. The expression of opinion can in no way be considered a guarantee for the sale or purchase of financial instruments, YOU are SOLELY responsible for the decisions you make, no one else, including me, assumes this risk.