

I've written about the dividend investing genre before in passing. In the past few months, I've noticed that domestic YouTube channels and other sites that were previously considered big promoters of dividend investing have stopped following the strategy. Instead, most have started buying ETFs and putting away the average market return.
However, I didn't see it written anywhere why, maybe because of the underperformance? Maybe the portfolio management was too complicated? I can't reveal the real reasons, but since I've been holding dividend-paying stocks since the beginning of 2020, I thought it was worth writing down my thoughts on the matter.
👆Important! The article is not intended to delve deeply into accounting rabbit holes, so there will be some gross simplifications, but these are for ease of understanding. They aim to highlight the essence and make the text understandable for the average person.
Dividend investing: the misunderstood genre
I think one of the drawbacks of dividend investing is that you have to understand the capital allocation of companies, which is not such a simple task. I'm sure 95% of investors don't even understand the basics, instead they follow intuitions and trends.They look at all these fancy charts that show that dividend stocks have outperformed the market, so they should buy them. This is especially true when dividend investing is fashionable, such as in a sideways or falling market environment.
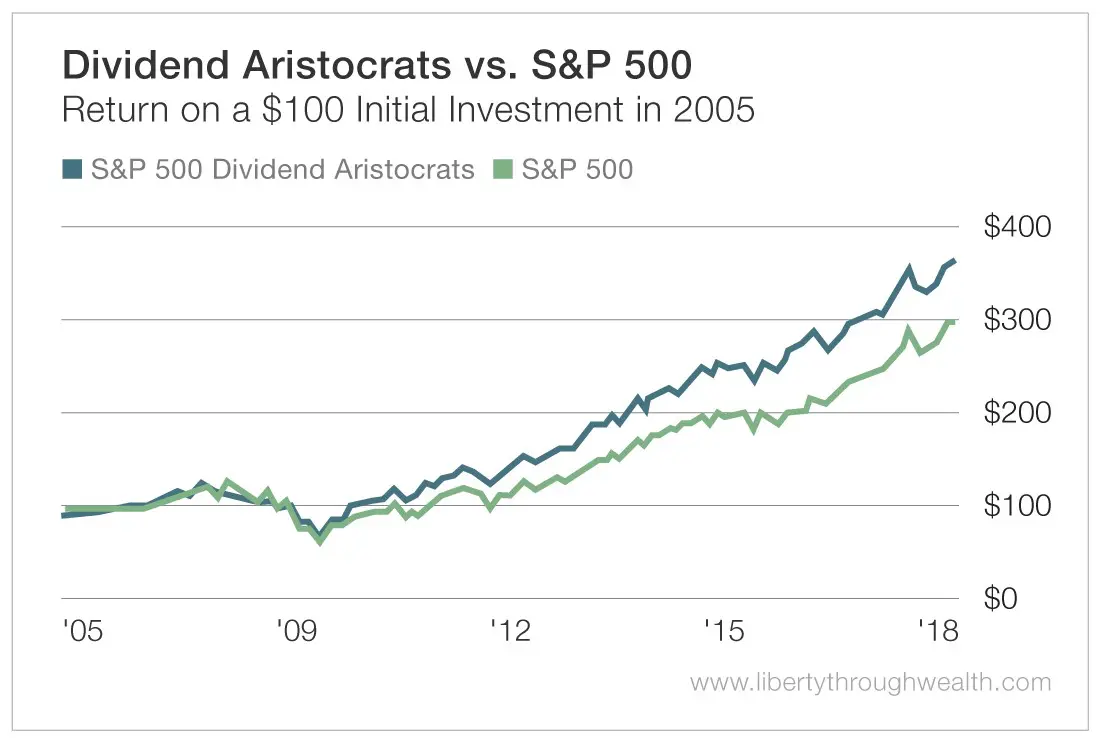
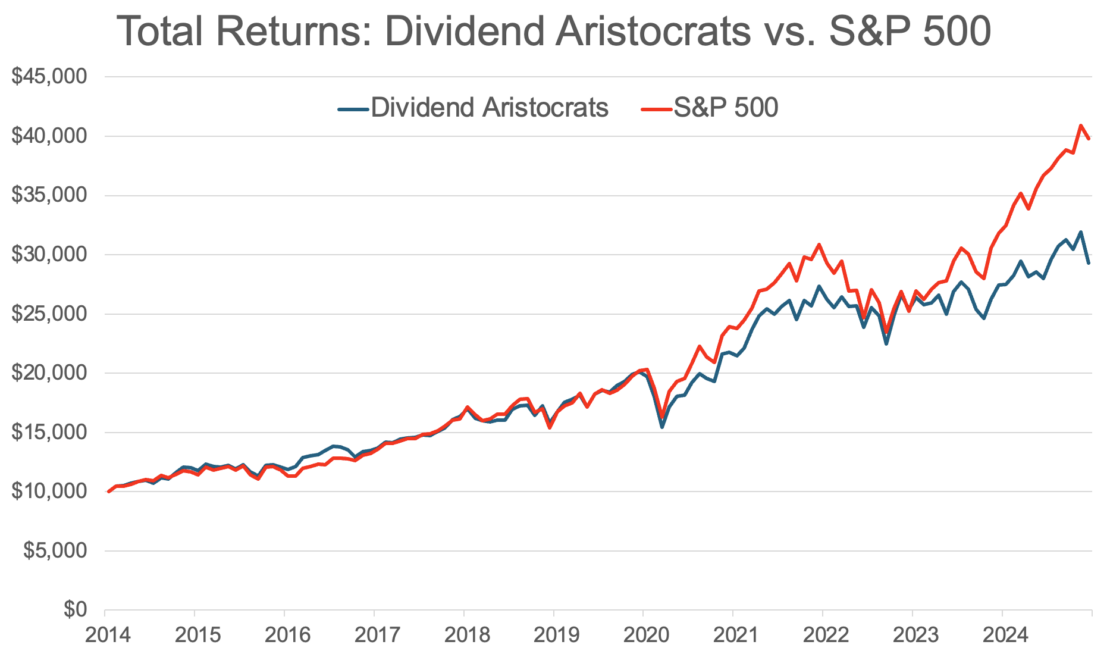
What does this mean exactly? In itself, nothing really, since the graphs refer to a given period, say the last 20-30 years, but if I choose a different period, I can even get the opposite result. Also important is that they usually only model the S&P 500 stocks, but that's okay since you can buy the most famous American index as an ETF, so I think this is a realistic scenario that most investors measure their returns by.
Where does the data on dividend investing outperformance come from? There are countless books and studies on the subject of dividend investing. Without claiming to be exhaustive, I have found a few that the very enthusiastic can read, while the internet is full of books. If I had to say one thing, it would be this: Geraldine Weiss: Dividends Don't LieThere is also a second part: Kelley Wright: Dividends Still Don't Lie.
But back to the studies, these are worth looking into if you are interested in the topic in more depth:
- Surprise! Higher Dividends = Higher Earnings Growth (2003)
- Do Dividends Matter More in Declining Markets? (2011)
- The Global Preference for Dividends in Declining Markets (2015)
- What Difference Do Dividends Make? (2016)
- The High Dividend Yield Return Advantage (2007)
- Dividend Investing and a Look Inside the S&P Dow Jones Dividend Indices (2012)
- A Fundamental Look at S&P 500 Dividend Aristocrats
- Do Dividends Matter More When Markets Falter?
- The Power of Dividends (Updated with 2025 data)
What is interesting is that 4 of the 9 studies above were done after a crisis, and unfortunately not all of them examine the same period, but they are worth at least running through. If you want to choose just one, look at the last one, because the data series there run from 1940 to 2025 and there are great explanatory figures, it is relatively easy to understand the gist of it.

Dividend investing is a buzzword
By itself, "dividend-paying stock" is just a label, and it does not follow from this whether dividend investing is a positive or negative strategy. For example, Alphabet, which pays a dividend, what is it? In other words, what label do you want to put on it? It could be a “dividend-paying,” “growth,” “ad-supported,” “cloud,” or even an “AI” stock, but none of these things mean anything by themselves. If you look at the company with the ticker symbol GOOGL, you can see that:
- 💰 pays dividends,
- 📈 Increased its revenues by an average of 18.6% over a 10-year period,
- 📢 the advertising leg generated 243,000 million USD in revenue in 2025,
- ☁️ the cloud services segment grew by 36% in 2025,
- 🤖 has its own artificial intelligence model, called Gemini,
so all labels will be true. The question is how much of the total return potential was provided by dividends, and how much of a role did other factors play in this. To put it simply: If most of the return comes from dividends and it outperformed the benchmark, then you can say that it was better to invest in this stock than in the index.
How does the yield potential come out?
When investors analyze a company, they determine its total return potential. This will be the number that the model predicts the company can realistically achieve in a given period, usually a 5-year period. The return potential of companies is determined by several factors. These may include the following:
- (I.e. valuation correction: If a company is undervalued, a correction in valuation will lead to an increase in the stock price. The opposite is also true: a correction in valuation of overvalued companies will lead to a decrease in the stock price. This effect is often referred to as “reversion to the mean” and is typically driven by sentiment (i.e. what the market thinks about the stock).
- (I.e. Pricing the company's fundamental performance: This differs from the previous one in that it is driven by the underlying business performance, i.e. the rate of return the company generates on the cash generated (IRR, or internal rate of return, but expressed as ROIC).
- (I.e. Share buyback/issuance: the result of the above, since the profit generated by the company is divided by the number of shares, this is EPS. If this is divided into fewer shares, then EPS increases, if it is divided into more, then it decreases. The specialty of share buybacks/issues is that this does not arise from the operation of the business, but from capital allocation decisions, see below.
- 💵 Return of capital to shareholders: This is the dividend paid. The higher it is, the more it adds to the return potential. It is usually characterized by the size of the dividend, the dividend yield, and the rate of dividend increases.
📈Simplifying the above, The return potential consists of the change in the valuation multiple + fundamental performance + dividend components.
So, for those who believe that dividend investing is an effective genre, the most important component will be dividends. The problem with this is that what the company pays out as dividends will actually reduce fundamental performance, as long as there is room for reinvestment in the business.

What is the basic problem with dividend payments?
Every capitalist company is created to make a profit. Regardless of how accounting shows this, you probably know that at the end of the whole process – paying expenses, amortizing, depreciating, paying interest, taking all kinds of write-offs, deducting taxes, etc. – the company is left with some cash.

This is important because you can always create a metric that says a company is “something”, such as cheap, efficient, fast growing, etc., but these are accounting tools. The point is how much physical spendable money is left after taxes and expenses are deducted. This can consist of generated free cash and credit, because that's the only way to pay out to owners and create value from it. But to do that, you need to understand a company's capital allocation options, that is, what it can do with its cash.
- ???? You can put it back into your business. This is the basic case, this is how companies achieve their organic growth. In the long run, organic growth should be priced into the share price, as the company will be worth more and more. The cash remains in the company, and no further tax liability arises.
- (I.e. You can reduce debt from it. If the company has debt, it can reduce it, while on the cost side, the interest burden decreases. The cash goes to the creditor, and in return, the company's liability is reduced.
- (I.e. You can buy back your own shares. The company buys back shares from the shares floating on the market. The cash is removed from the balance sheet and goes to the selling investor, while the purchased shares are placed in the "treasury", or the shares can be withdrawn from the market. The company's share price – in an ideal world – is proportional to the number of shares repurchased rises, since the same performance is distributed over fewer shares.
- 🤝 You can acquire other companies. The cash is spent to acquire minority or majority stakes in other companies. Cash does not leave the company, but is consolidated in some form – asset, goodwill, etc. The problem with acquisitions is that it is difficult to assess the fair value of assets and intangible assets in advance, so the risk of failure is high.
- 💵 You can pay it as a dividend. The company pays out some or all of the cash it generates to the owner as dividends. The cash is removed from the balance sheet and lands in the owners' accounts, after which a tax liability arises.
The above shows the main problem with paying dividends: the value of the company decreases by the amount spent on dividends, meaning that this amount is lost to them, while the investor is subject to tax. The problem is that:
- 🧾 In most countries, withholding tax is payable on dividends, which is what investors most often fail to do. In the case of US stocks, this means 30% of the income as a Hungarian tax resident.
- 🇭🇺 Tax must be paid on dividends in addition to the withheld tax. In Hungary, this is 13% SZOCHO+5% SZJA, so you have to pay 30+13+5=48% tax on American dividends, meaning the dividend yield is roughly halved.
- 📑 Countries with which there is a double taxation agreement, The Hungarian 15% personal income tax can in principle be included in the tax deducted and withheld abroad, but documenting this is a "good luck" category, in practice you just write it off as a loss. In the case of small items, it is not worth bothering with it.
There is also one more thing that few people think about: reinvestment risk. You have to reinvest the money you receive somewhere, at least as efficiently as the company did, multiplied by the amount you missed on taxes. Then you'll be in the same place as if the money never left the company. It is highly unlikely that you will be able to do this.
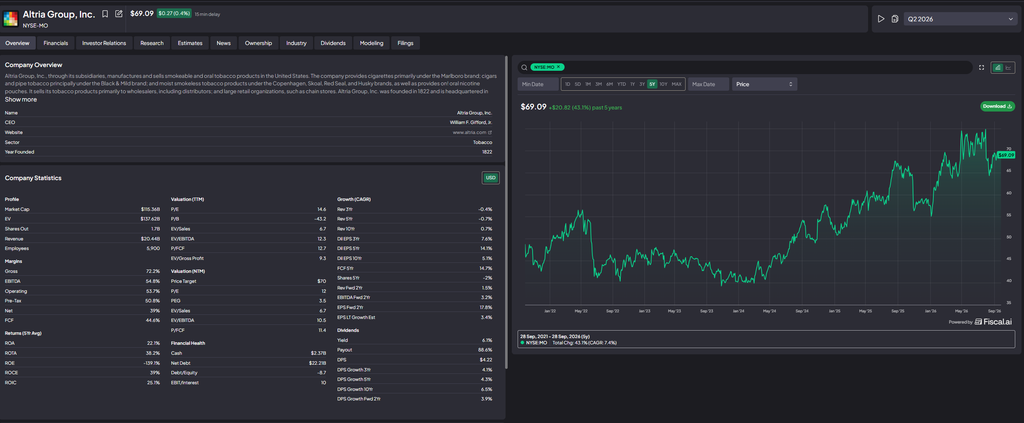
There is another anomaly related to reinvestment risk: the opportunity cost of reinvestment. With small portfolios, it simply isn't possible to meaningfully reinvest dividends due to the high costs. Let's say you're an Altria stockholder. The company pays a dividend of $4.22 at a price of $69.09, which is a dividend yield of 6.1% at the time of writing.
You buy $2000 worth of Altria shares, so for the sake of simplicity, you get 29 shares, which pays a dividend of $122.38 per year. However, it pays this quarterly, so you will receive ~$30.5 every three months. Let's invest this in something:
- LightYear: minimum investment cost 0.1%/transaction, but min. 1 USD, which is 3.25% in the case of 30.5 USD! cost,
- IBKR: minimum investment cost 0.005 USD/share, but min. 2 USD, which is 6.5%! cost in the case of 30.5 USD,
- Erste, KBC: minimum investment cost 0.45%/transaction, but min. 7 USD, which is ~30%! cost for 30.5 USD.
If you add up the entire year's dividends, you've missed out on a year's stock market return, which we usually calculate as 10% as a rule of thumb. Of course, with a portfolio size of USD 100,000, the costs are already dwarfed, but if you had left the same money in a non-dividend-paying stock, it wouldn't have generated any costs.
🤔Tip: if you're looking for a passive ETF containing dividend-paying stocks that reinvests dividends, you'll be much better off on the cost side.

Dividend investing: everything is fine in theory
So why has dividend investing become popular? For several reasons:
- because it was popular, many people promoted the method, many studies were done on it,
- because it provides a continuous, growing cash flow, which is attractive to investors,
- because many investors thought that stocks could be used as a bond replacement (they can't, but that's another question),
- because in theory the math looks really good.
Except for the first one, which has already been discussed, I would like to add a thought to each one, based on my own experiences.
Growing cash flow
I think one of the most important sources of data for the movement was the DRIP Investing site: Dripinvesting.org. A gentleman named David Fish did it until 2018 when he passed away; Justin Law took over. They will mail you a full list of dividend-paying champions if you'd like. "Dividend king" stocks have been paying dividends continuously for more than 50 years, and most of them are also increasing them. What could be wrong with such companies if they have been just "giving away" the money they make to investors for so long? You'll find out below!
Bond substitute
A few years ago I tried to use stocks as a bond substitute – e.g. AT&T – but this is a fundamental mistake, don't make it after me. In the case of bonds, especially government securities, there is a guarantor who pays, the bond has a face value that you get back at maturity, and the rights of creditors are completely different from those of shareholders. Not to mention that the price of bonds moves based on a completely different logic than that of stocks, and it doesn't put as much pressure on you as a stock, since a bond has a maturity date where you get back the face value, while a stock doesn't. Never consider any stock as a substitute for bonds, it doesn't work in practice.
Dividend math
Let's look at the dividend math, because it looks really good in theory. Let's say our sample company has the following data:
- 🏢 the company has 1000 shares,
- 🏷️ its stock is listed at 100 USD,
- 💵 produces 50,000 USD cash,
- ✂️ you pay 10% of this, which is 5000 USD,
- 🎯 so the dividend per share will be 5 USD,
- 📊 the dividend yield is 5% (5/100=0.05, or 5%),
- 📈 and the company also promises to increase this amount by 10% per year (as a comparison basis, the same increase rate of 3% was used before).
Given that stocks under the Dividend Challenger label on DRIP Investing's list have paid and increased dividends for 5-9 consecutive years, Contenders for 10-24, Champions for 25, and Kings for 50 consecutive years, the above numbers are not entirely far-fetched. Based on this, in an ideal world, over a 50-year period, the company's dividend would look like this:
| Ev | Annual 3% increase | Annual 10% increase | ||||||||
|---|---|---|---|---|---|---|---|---|---|---|
| Lifting | Dividend (USD) | Yield on the in. price | Exp. rate* | Cumulative (USD) | Lifting | Dividend (USD) | Yield on the in. price | Exp. rate* | Cumulative (USD) | |
| 0 | 5.00 | 5.0 % | 10 % | 5.00 | 5.00 | 5.0 % | 10 % | 5.00 | ||
| 1 | 3% | 5.15 | 5.2 % | 10 % | 10.15 | 10 % | 5.50 | 5.5 % | 11 % | 10.50 |
| 2 | 3% | 5.30 | 5.3 % | 11 % | 15.45 | 10 % | 6.05 | 6.1 % | 12 % | 16.55 |
| 3 | 3% | 5.46 | 5.5 % | 11 % | 20.92 | 10 % | 6.66 | 6.7 % | 13 % | 23.21 |
| 4 | 3% | 5.63 | 5.6 % | 11 % | 26.55 | 10 % | 7.32 | 7.3 % | 15 % | 30.53 |
| 5 | 3% | 5.80 | 5.8 % | 12 % | 32.34 | 10 % | 8.05 | 8.1 % | 16 % | 38.58 |
| 6 | 3% | 5.97 | 6.0 % | 12 % | 38.31 | 10 % | 8.86 | 8.9 % | 18 % | 47.44 |
| 7 | 3% | 6.15 | 6.1 % | 12 % | 44.46 | 10 % | 9.74 | 9.7 % | 19 % | 57.18 |
| 8 | 3% | 6.33 | 6.3 % | 13 % | 50.80 | 10 % | 10.72 | 10.7 % | 21 % | 67.90 |
| 9 | 3% | 6.52 | 6.5 % | 13 % | 57.32 | 10 % | 11.79 | 11.8 % | 24 % | 79.69 |
| 10 | 3% | 6.72 | 6.7 % | 13 % | 64.04 | 10 % | 12.97 | 13.0 % | 26 % | 92.66 |
| 11 | 3% | 6.92 | 6.9 % | 14 % | 70.96 | 10 % | 14.27 | 14.3 % | 29 % | 106.92 |
| 12 | 3% | 7.13 | 7.1 % | 14 % | 78.09 | 10 % | 15.69 | 15.7 % | 31 % | 122.61 |
| 13 | 3% | 7.34 | 7.3 % | 15 % | 85.43 | 10 % | 17.26 | 17.3 % | 35 % | 139.87 |
| 14 | 3% | 7.56 | 7.6 % | 15 % | 92.99 | 10 % | 18.99 | 19.0 % | 38 % | 158.86 |
| 15 | 3% | 7.79 | 7.8 % | 16 % | 100.78 | 10 % | 20.89 | 20.9 % | 42 % | 179.75 |
| 16 | 3% | 8.02 | 8.0 % | 16 % | 108.81 | 10 % | 22.97 | 23.0 % | 46 % | 202.72 |
| 17 | 3% | 8.26 | 8.3 % | 17 % | 117.07 | 10 % | 25.27 | 25.3 % | 51 % | 228.00 |
| 18 | 3% | 8.51 | 8.5 % | 17 % | 125.58 | 10 % | 27.80 | 27.8 % | 56 % | 255.80 |
| 19 | 3% | 8.77 | 8.8 % | 18 % | 134.35 | 10 % | 30.58 | 30.6 % | 61 % | 286.37 |
| 20 | 3% | 9.03 | 9.0 % | 18 % | 143.38 | 10 % | 33.64 | 33.6 % | 67 % | 320.01 |
| 21 | 3% | 9.30 | 9.3 % | 19 % | 152.68 | 10 % | 37.00 | 37.0 % | 74 % | 357.01 |
| 22 | 3% | 9.58 | 9.6 % | 19 % | 162.26 | 10 % | 40.70 | 40.7 % | 81 % | 397.72 |
| 23 | 3% | 9.87 | 9.9 % | 20 % | 172.13 | 10 % | 44.77 | 44.8 % | 90 % | 442.49 |
| 24 | 3% | 10.16 | 10.2 % | 20 % | 182.30 | 10 % | 49.25 | 49.2 % | 98 % | 491.74 |
| 25 | 3% | 10.47 | 10.5 % | 21 % | 192.77 | 10 % | 54.17 | 54.2 % | 108 % | 545.91 |
| 26 | 3% | 10.78 | 10.8 % | 22 % | 203.55 | 10 % | 59.59 | 59.6 % | 119 % | 605.50 |
| 27 | 3% | 11.11 | 11.1 % | 22 % | 214.65 | 10 % | 65.55 | 65.5 % | 131 % | 671.05 |
| 28 | 3% | 11.44 | 11.4 % | 23 % | 226.09 | 10 % | 72.10 | 72.1 % | 144 % | 743.15 |
| 29 | 3% | 11.78 | 11.8 % | 24 % | 237.88 | 10 % | 79.32 | 79.3 % | 159 % | 822.47 |
| 30 | 3% | 12.14 | 12.1 % | 24 % | 250.01 | 10 % | 87.25 | 87.2 % | 174 % | 909.72 |
| 31 | 3% | 12.50 | 12.5 % | 25 % | 262.51 | 10 % | 95.97 | 96.0 % | 192 % | 1 005.69 |
| 32 | 3% | 12.88 | 12.9 % | 26 % | 275.39 | 10 % | 105.57 | 105.6 % | 211 % | 1 111.26 |
| 33 | 3% | 13.26 | 13.3 % | 27 % | 288.65 | 10 % | 116.13 | 116.1 % | 232 % | 1 227.38 |
| 34 | 3% | 13.66 | 13.7 % | 27 % | 302.31 | 10 % | 127.74 | 127.7 % | 255 % | 1 355.12 |
| 35 | 3% | 14.07 | 14.1 % | 28 % | 316.38 | 10 % | 140.51 | 140.5 % | 281 % | 1 495.63 |
| 36 | 3% | 14.49 | 14.5 % | 29 % | 330.87 | 10 % | 154.56 | 154.6 % | 309 % | 1 650.20 |
| 37 | 3% | 14.93 | 14.9 % | 30 % | 345.80 | 10 % | 170.02 | 170.0 % | 340 % | 1 820.22 |
| 38 | 3% | 15.37 | 15.4 % | 31 % | 361.17 | 10 % | 187.02 | 187.0 % | 374 % | 2 007.24 |
| 39 | 3% | 15.84 | 15.8 % | 32 % | 377.01 | 10 % | 205.72 | 205.7 % | 411 % | 2 212.96 |
| 40 | 3% | 16.31 | 16.3 % | 33 % | 393.32 | 10 % | 226.30 | 226.3 % | 453 % | 2 439.26 |
| 41 | 3% | 16.80 | 16.8 % | 34 % | 410.12 | 10 % | 248.93 | 248.9 % | 498 % | 2 688.18 |
| 42 | 3% | 17.30 | 17.3 % | 35 % | 427.42 | 10 % | 273.82 | 273.8 % | 548 % | 2 962.00 |
| 43 | 3% | 17.82 | 17.8 % | 36 % | 445.24 | 10 % | 301.20 | 301.2 % | 602 % | 3 263.20 |
| 44 | 3% | 18.36 | 18.4 % | 37 % | 463.60 | 10 % | 331.32 | 331.3 % | 663 % | 3 594.52 |
| 45 | 3% | 18.91 | 18.9 % | 38 % | 482.51 | 10 % | 364.45 | 364.5 % | 729 % | 3 958.98 |
| 46 | 3% | 19.48 | 19.5 % | 39 % | 501.98 | 10 % | 400.90 | 400.9 % | 802 % | 4 359.87 |
| 47 | 3% | 20.06 | 20.1 % | 40 % | 522.04 | 10 % | 440.99 | 441.0 % | 882 % | 4 800.86 |
| 48 | 3% | 20.66 | 20.7 % | 41 % | 542.70 | 10 % | 485.09 | 485.1 % | 970 % | 5 285.95 |
| 49 | 3% | 21.28 | 21.3 % | 43 % | 563.98 | 10 % | 533.59 | 533.6 % | 1% | 5 819.54 |
| Ev | Annual 3% increase | Annual 10% increase | ||||||||
| Lifting | Dividend (USD) | Yield on the in. price | Exp. rate* | Cumulative (USD) | Lifting | Dividend (USD) | Yield on the in. price | Exp. rate* | Cumulative (USD) | |
| 50 | 3% | 21.92 | 21.9 % | 44 % | 585.90 | 10 % | 586.95 | 587.0 % | 1% | 6 406.50 |
* Payout ratio if the company's $50,000 cash production does not increase.
Dividend investing: less common in practice
Why won't the above numbers come true? Firstly, because such dividends and dividend increase rates only exist on paper, not in reality. If that were true, the market should be full of targets with dividend yields of 60-70%, but you won't find too many of them. Secondly, because for this to be possible at all:
- 💵 in the long term, the company should increase the cash generated at least at the rate of the dividend increase, as only then can it pay out the increased dividend (in theory, it could also pay out of debt, but not over 50 years),
- 🚫 they should almost never suspend, cut or cease dividends,
- 📈 they should increase the dividend completely consistently (which would also increase the amount per share based on the compound interest principle),
- 🏷️ Even if the almost impossible triple criteria listed above are maintained, this should not be priced into the price, because then you would not be able to buy the paper with a high dividend yield.
????In reality, what usually happens is that after the early rapid increases, the rate of increase slows down, then in a more serious crisis, cash flow stops, there is a dividend suspension or cut, and the momentum is already broken, and it's time to start all over again.
And you can already guess the gist of this: If there is a problem, one of the easiest ways to reduce costs is to cut or suspend dividends, as then you don't have to pay them.This is even more true for European stocks than in the US, where companies do not consider dividend payments a sacred cow. How much would you want to have a stock in your portfolio that, in the event of a crisis, simply “throws away” the very feature you bought it for?
What the math says: reinvestment vs. dividend investing
Let me get back to capital allocation for a moment. Let's say our model company has no debt, doesn't want to acquire others, and doesn't buy back its own shares. It has only two options: rollback (which will cause an increase in the exchange rate) and the dividend payment (this amount will be taken out of the company and will go to the investors).
We also assume that our sample company is able to achieve a 15% internal return on invested capital, which is considered very good and is an important criterion for quality companies. In other words: it doubles the cash generated every 5 years. Let's also assume that you generate 100 USD in cash and that you have three options:
- 🌱 Option A: It reinvests 100% but does not pay dividends,
- ⚖️ Option B: It reinvests 90% of the money, pays out 10% as dividends (dividend yield: 1.5%),
- 💵 Option C: It reinvests 50% of the money and pays out 50% as dividends (dividend yield: 7.5%).
| Ev | A: value (100% return) | A: cumulative dividend | B: value (90% back) | B: cumulative dividend | B: total | C: value (50% back) | C: cumulative dividend | C: total |
|---|---|---|---|---|---|---|---|---|
| 1 | 115.0 | 0.0 | 113.5 | 1.5 | 115.0 | 107.5 | 7.5 | 115.0 |
| 2 | 132.3 | 0.0 | 128.8 | 3.2 | 132.0 | 115.6 | 15.6 | 131.1 |
| 3 | 152.1 | 0.0 | 146.2 | 5.1 | 151.3 | 124.2 | 24.2 | 148.5 |
| 4 | 174.9 | 0.0 | 166.0 | 7.3 | 173.3 | 133.5 | 33.5 | 167.1 |
| 5 | 201.1 | 0.0 | 188.4 | 9.8 | 198.2 | 143.6 | 43.6 | 187.1 |
| 6 | 231.3 | 0.0 | 213.8 | 12.6 | 226.4 | 154.3 | 54.3 | 208.7 |
| 7 | 266.0 | 0.0 | 242.6 | 15.8 | 258.5 | 165.9 | 65.9 | 231.8 |
| 8 | 305.9 | 0.0 | 275.4 | 19.5 | 294.9 | 178.3 | 78.3 | 256.7 |
| 9 | 351.8 | 0.0 | 312.6 | 23.6 | 336.2 | 191.7 | 91.7 | 283.4 |
| 10 | 404.6 | 0.0 | 354.8 | 28.3 | 383.1 | 206.1 | 106.1 | 312.2 |
| 11 | 465.2 | 0.0 | 402.7 | 33.6 | 436.3 | 221.6 | 121.6 | 343.1 |
| 12 | 535.0 | 0.0 | 457.0 | 39.7 | 496.7 | 238.2 | 138.2 | 376.4 |
| 13 | 615.3 | 0.0 | 518.7 | 46.5 | 565.3 | 256.0 | 156.0 | 412.1 |
| 14 | 707.6 | 0.0 | 588.8 | 54.3 | 643.1 | 275.2 | 175.2 | 450.5 |
| 15 | 813.7 | 0.0 | 668.2 | 63.1 | 731.4 | 295.9 | 195.9 | 491.8 |
| 16 | 935.8 | 0.0 | 758.5 | 73.2 | 831.6 | 318.1 | 218.1 | 536.2 |
| 17 | 1076.1 | 0.0 | 860.9 | 84.5 | 945.4 | 341.9 | 241.9 | 583.9 |
| 18 | 1237.5 | 0.0 | 977.1 | 97.5 | 1074.5 | 367.6 | 267.6 | 635.2 |
| 19 | 1423.2 | 0.0 | 1109.0 | 112.1 | 1221.1 | 395.1 | 295.1 | 690.3 |
| 20 | 1636.7 | 0.0 | 1258.7 | 128.7 | 1387.4 | 424.8 | 324.8 | 749.6 |
All values are in USD. Dividends are not reinvested by the investor, and no taxes are calculated.
For simplicity, the exchange rate moves with the invested capital throughout, That is, the valuation multiplier does not change, which is completely unrealistic anyway. In reality, a company with a 15% return is trading at a premium, so the investor cannot reinvest the dividends paid with the same return because the price is constantly increasing. This is exactly what makes the company's own reinvestment valuable. Based on this, by the end of the 20th year, you will have the following results:
| Option | Rewind | Value in year 20 | Total in year 20 (value + accumulated dividends) | CAGR: exchange rate only | CAGR: price + dividend |
|---|---|---|---|---|---|
| A | 100 % | 1636.7 | 1636.7 | 15.00 % | 15.00 % |
| B | 90 % | 1258.7 | 1387.4 | 13.50 % | 14.05 % |
| C | 50 % | 424.8 | 749.6 | 7.50 % | 10.60 % |
All values are in USD, from a starting capital of 100 USD.
But I cheated in one place in the table, I don't know if you noticed! I intentionally didn't deduct the tax, because I don't know in which country the capital gains and dividend payments are taxed in the case of US stocks. Let's use the Hungarian example:
- 📈 exchange rate gain 15% SZJA, but 0% tax on TBSZ,
- 💵 Dividend: 30% withholding tax + 13% SZOCHO + 5% SZJA, 48% tax, but only 30% on TBSZ for US stocks (you can use other numbers if you prefer).
So you will lose a significant portion of the dividend due to taxes, so the end result will be even worse, roughly as follows:
| Ev | A: value (100% return) | A: cumulative dividend | B: value (90% back) | B: cumulative net dividend | B: total | C: value (50% back) | C: cumulative net dividend | C: total |
|---|---|---|---|---|---|---|---|---|
| 1 | 115.0 | 0.0 | 113.5 | 1.1 | 114.6 | 107.5 | 5.3 | 112.8 |
| 2 | 132.3 | 0.0 | 128.8 | 2.2 | 131.1 | 115.6 | 10.9 | 126.5 |
| 3 | 152.1 | 0.0 | 146.2 | 3.6 | 149.8 | 124.2 | 17.0 | 141.2 |
| 4 | 174.9 | 0.0 | 166.0 | 5.1 | 171.1 | 133.5 | 23.5 | 157.0 |
| 5 | 201.1 | 0.0 | 188.4 | 6.9 | 195.2 | 143.6 | 30.5 | 174.1 |
| 6 | 231.3 | 0.0 | 213.8 | 8.8 | 222.6 | 154.3 | 38.0 | 192.4 |
| 7 | 266.0 | 0.0 | 242.6 | 11.1 | 253.7 | 165.9 | 46.1 | 212.0 |
| 8 | 305.9 | 0.0 | 275.4 | 13.6 | 289.0 | 178.3 | 54.8 | 233.2 |
| 9 | 351.8 | 0.0 | 312.6 | 16.5 | 329.1 | 191.7 | 64.2 | 255.9 |
| 10 | 404.6 | 0.0 | 354.8 | 19.8 | 374.6 | 206.1 | 74.3 | 280.4 |
| 11 | 465.2 | 0.0 | 402.7 | 23.5 | 426.2 | 221.6 | 85.1 | 306.7 |
| 12 | 535.0 | 0.0 | 457.0 | 27.8 | 484.8 | 238.2 | 96.7 | 334.9 |
| 13 | 615.3 | 0.0 | 518.7 | 32.6 | 551.3 | 256.0 | 109.2 | 365.3 |
| 14 | 707.6 | 0.0 | 588.8 | 38.0 | 626.8 | 275.2 | 122.7 | 397.9 |
| 15 | 813.7 | 0.0 | 668.2 | 44.2 | 712.4 | 295.9 | 137.1 | 433.0 |
| 16 | 935.8 | 0.0 | 758.5 | 51.2 | 809.7 | 318.1 | 152.7 | 470.7 |
| 17 | 1076.1 | 0.0 | 860.9 | 59.2 | 920.0 | 341.9 | 169.4 | 511.3 |
| 18 | 1237.5 | 0.0 | 977.1 | 68.2 | 1045.3 | 367.6 | 187.3 | 554.9 |
| 19 | 1423.2 | 0.0 | 1109.0 | 78.5 | 1187.4 | 395.1 | 206.6 | 601.8 |
| 20 | 1636.7 | 0.0 | 1258.7 | 90.1 | 1348.8 | 424.8 | 227.3 | 652.1 |
| CAGR (20 years) | 15.00 % | 13.50 % | 13.89 % | 7.50 % | 9.83 % |
All values are in USD. Held in TBSZ, 30% US withholding tax deducted from dividends, dividends are not reinvested by the investor.
Of course, the smart ones are already commenting that if you had reinvested the dividend into the stock, you would have gotten almost the same result as if the company had reinvested the cash itself. But:
- 💸 reinvestment has a cost that is not usually included in statements,
- ⏳ if the dividend rate is lower than the share price, you have to wait to reinvest, which means an opportunity cost (in other words: another crash),
- 🏷️ In reality, due to the appreciation, you would not be able to buy the stock at the same price as before, but only at a much higher price.
Of course, the aforementioned ETF containing dividend-paying stocks can be a good solution to these problems. And then, in addition to the above, I still assumed that they would not suspend or cut the dividend.
Dividend investing: do the studies lie?
If what has been said so far is true, then why can they show from time to time that dividend investing beats the group of stocks that do not pay dividends? There are several reasons for this, one of which is that there are periods in the market when stocks are sideways or falling. During these times, dividends, unless suspended or cut, It serves as a support, as it is easier to hold the paper and the dividend also compensates for the exchange rate loss resulting from the fall to some extent. The problem is that the market rises in most cases, but if you put together the time period in such a way that there is a major crisis at the beginning and at the end, you can easily show results in which the return on dividend-paying stocks will be higher.
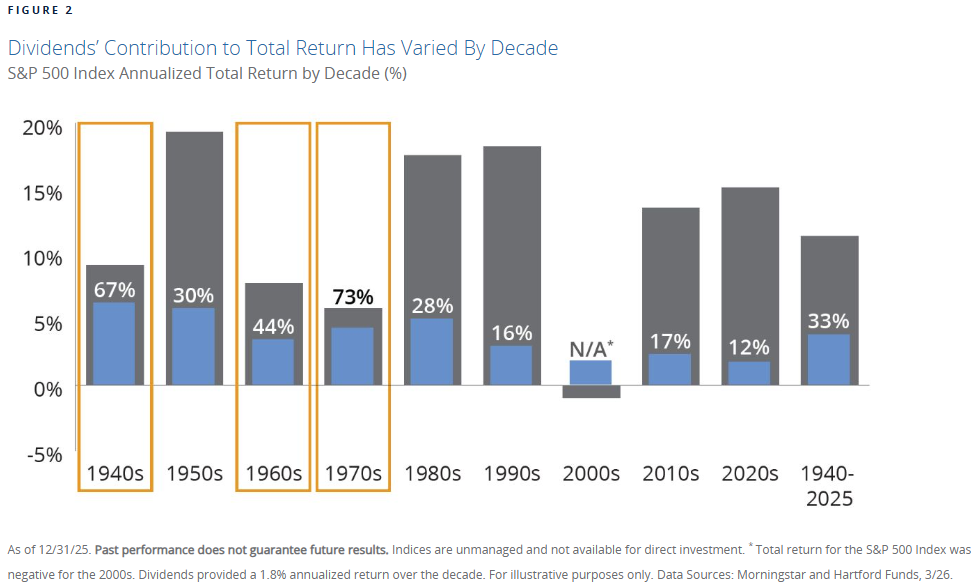
However, there is a much more prosaic reason for dividend-paying stocks to outperform: Only companies that generate a lot of cash and have the means to pay it out can pay dividends, so they are better than average. The chart above shows the percentage of total return potential that dividends provided in each decade. Of the 10 periods examined, dividends provided the majority of the return in 3, but not in 7. Most tellingly, when the entire period is combined, dividends have been badly underperforming over the 85-year period between 1940 and 2025.
It is not difficult to see that if a company reinvests its capital twice as efficiently as the average and pays out a portion of it as dividends, it will still trade at a higher valuation than other stocks..
💡Let's draw the conclusion: Companies with better than average quality do not outperform the market because they pay dividends, but rather they are able to pay dividends because they are of better quality and therefore outperform the market.
To show how unnecessary dividend payments are, here is an online table of the Top 10 S&P 500 companies with the highest price gains, 5 of which do not pay dividends and 5 only pay symbolic dividends, but the payout ratio nowhere reaches 30%. Incidentally, the reason for the low dividend yield is exactly what I mentioned earlier: Quality is priced in over the long term and depresses dividend yields.
| Ticker | Name | 20-year yield | Total return | Does it pay dividends? | Dividend yield | Kifizetési arány | Main sector |
|---|---|---|---|---|---|---|---|
| NVDA | Nvidia Corp. | ~17,000% | ~9,500%+ | Yes, symbolic. | Up to 0.4% | Up to 15% | Technology / Semiconductors |
| NFLX | Netflix Inc. | ~17,000% | ~9,500%+ | Gender | Communication services | ||
| Tpl | Texas Pacific Land Corp. | ~17,000% | Yes, symbolic. | Up to 0.6% | ~25–30% | Energy / Real Estate | |
| AAPL | Apple Inc. | ~17,000% | ~9,500%+ | Yes, symbolic. | Up to 0.3% | Up to 13% | Technology / Electronics |
| BKNGMore | Booking Holdings | ~17,000% | ~9,500%+ | Yes, symbolic. | Up to 0.9% | ~21–25% | Cyclical Consumption / Travel |
| Mnst | monster drink | ~17,000% | ~9,500%+ | Gender | Basic consumer goods | ||
| ISRG | Intuitive Surgical | ~17,000% | Gender | Healthcare / Medical Technology | |||
| AMZN | Amazon.com Inc. | ~17,000% | ~9,500%+ | Gender | Cyclical Consumption / E-commerce | ||
| TSLA | Tesla Inc. | ~26,000% (15–20 years) | Gender | Automotive / Technology | |||
| ODFL | Old Dominion Freight Line | ~9,500%+ | Yes, symbolic. | Up to 0.5% | Up to 24% | Industrial / Logistics |
Yields are estimates, the exact value depends on the start and end dates you choose. Dividend yield and payout ratio (dividends as a percentage of net profit) are rounded values for 2026.
If paying dividends is such a good thing, why aren't they paid out in larger amounts? Because they aren't. So why do they pay dividends anyway? Because they are growing and generating money so fast that they can no longer effectively reinvest it into their business, and since their share price is skyrocketing, they can't buy back their own shares at a good price, so for lack of a better word, they pay out the rest. The opposite is also true: if a company pays out the majority of its cash generated as dividends, but its share price still does not match the market average, then it cannot grow organically at an adequate rate.
When is it worth deciding to invest in dividends?
If you look at the article linked below, which contains my portfolio, you may notice that I also have two stocks that specifically pay dividends, Simon Property Group (SPG) and Philip Morris (PM).
So isn't it stupid to buy dividend-paying stocks? I never said it was! On the one hand, the result often depends on the period you are looking at, and on the other hand, there are exceptions to every rule, and I'll show you what they are.
Simon Property Group (SPG)
I started buying the stock during COVID, in 2020, the average price was 63.03 USD, the price on the day of writing the article was 203.39 USD. SPG pays a dividend of 8.9 USD per share, which means a dividend yield of 14.12% on cost, and after deducting the 30% tax, it is 9.88%. This is roughly the 120-year market average, which is where the price gain came from.
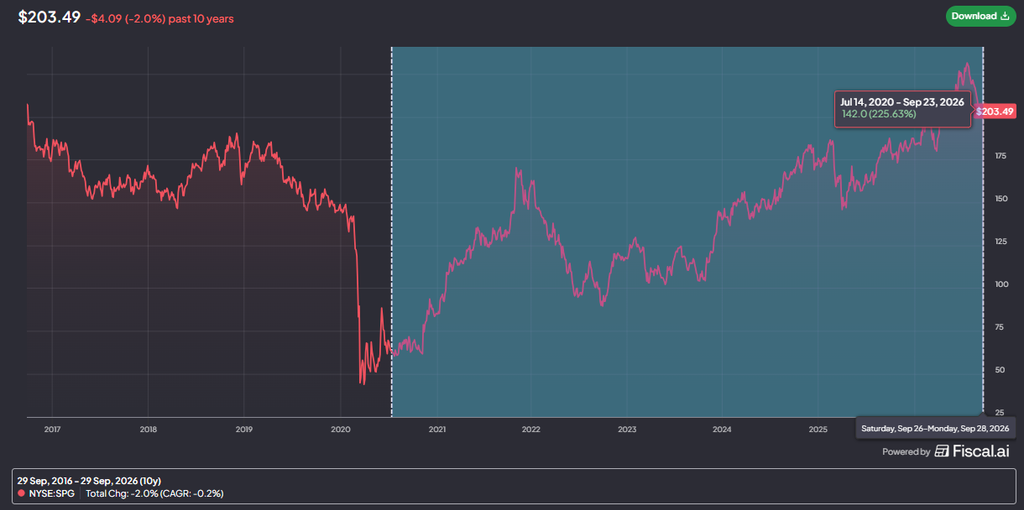
I included the image above because it clearly shows that the price increase brought about +225%, while over a 10-year period the price generated a CAGR of -0.2%, so essentially NOTHING, there was no real fundamental return, just a valuation correction. Apart from the dividend, you would not have realized any return in the world at the current valuation. What follows from this? That the majority of the return was due to the valuation correction, not the stock soaring. However, the dividend provides a nice amount of income even after the correction.
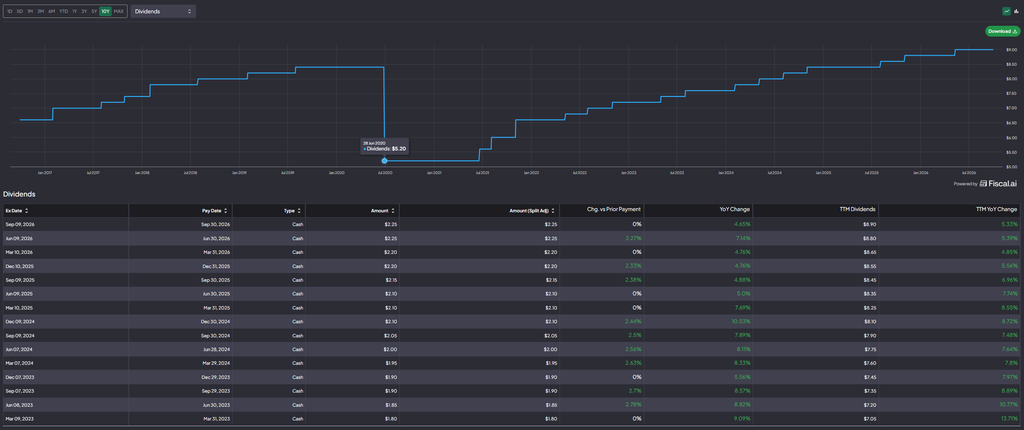
However, in SPG's defense, I must mention that this required cutting the dividend from 8.35 USD to 3.9 USD, a total of 53%, I started shopping here. However, the picture also shows that the company nicely increased the payout above the original, but the dividend yield did not become as high, as the share price rose faster.
💡Lesson: You can make big profits from a correction after a beaten-down share price and a dividend cut, but this would also be true for companies that do not pay dividends.
Philip Morris (PM)
Also during COVID, I started buying the stock in 2020, the average price was 79.06 USD, the price on the day of writing the article is 192.78 USD. PM pays a dividend of 5.78 USD per share, which means a dividend yield of 7.44% on cost. But Philip Morris is an 80/20 stock, which means that since it collects more than 80% of its income from abroad, it hardly has to pay dividend tax, the withholding tax is roughly 1.5%.
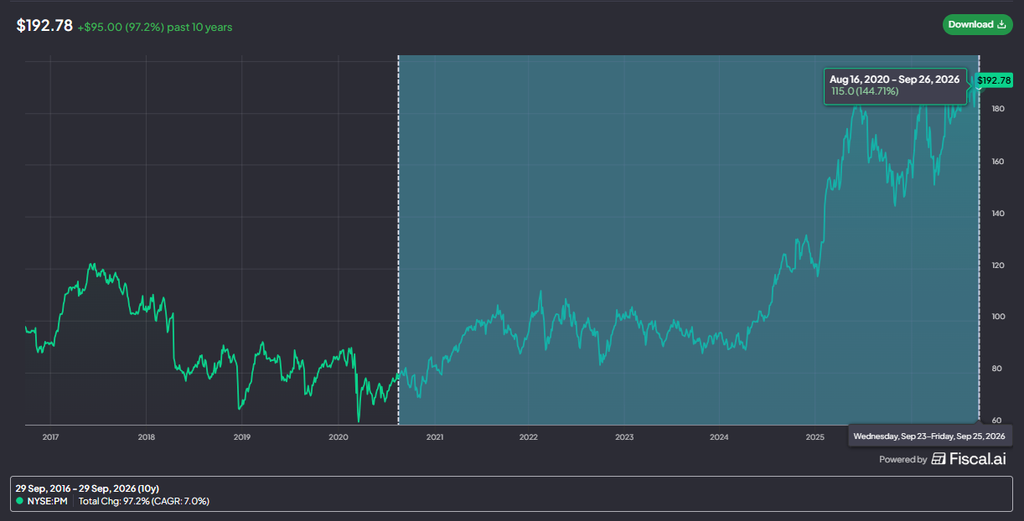
The picture is the same as in the case of SPG: +145% price gain, but here there is also a 7% CAGR annual return over a 10-year period, meaning there was fundamental performance, plus a dividend yield of over 7%, which allows the company to beat the S&P 500's long-term average of approximately 10%.
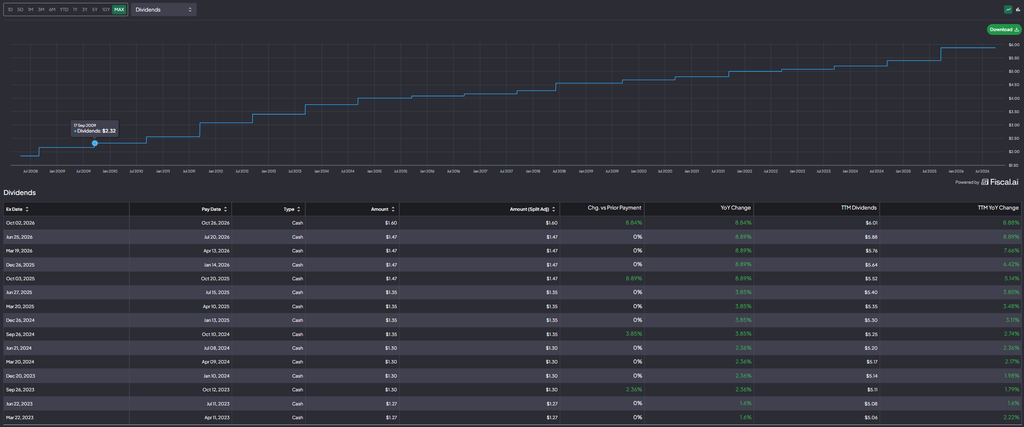
The difference compared to Simon Property Group is that there was neither a dividend cut nor a suspension, but here too the valuation correction and fundamental performance weighed more heavily on the stock than the dividend. Since PM is the best quality tobacco company on the market, this is not so surprising. The company can't reinvest all the cash it generates, so they pay it out, which is what I mentioned earlier.
💡Lesson: The combination of the correction of the overvalued valuation and the very high quality resulted in an outperformance, which was rewarded with a dividend.
Secret tip: British companies
For British companies, the withholding tax on dividends is 0%. Based on the PM and SPG example above, if there is a major crisis and thus a major drop in prices, it is worth buying very high-quality, dividend-paying stocks, especially after a dividend cut. But basically, not because they pay dividends, but because, in addition to price correction and fundamental performance, dividends are a good addition that increases returns. A few tips on which dividend-paying companies I would take a closer look at:
- (I.e.Games Workshop (LSE:GAW),
- 🚗Admiral Group plc (LSE:ADM),
- 🏠Rightmove plc (LSE:RMV),
- (I.e.Judges Scientific (AIM:JDG),
- 💷Spectra Systems Corporation (AIM:SPSY),
- 📊AJ Bell plc (LSE:AJB).
All of them are pretty good quality companies, analyze them to see if you like one of them and if you buy it at the right time, you can realize a nice return on it.
Dividend investment: summary
Let's distill what has been said so far: I don't think dividend-paying companies outperform because they pay dividends. They can pay dividends because they are of better quality than the market average and generate so much cash that after a while they can no longer reinvest it all into their business, so they pay it out instead.But the dividend is symbolic in these cases as well, and not where most of the return potential comes from.
Dividends help investors when the market is in a prolonged decline. For example, during the 2008-2009 crisis, it makes it easier to hold securities, supports returns, and even outperforms in certain periods, but overall, it is not worth building a complete portfolio on it. Focus on quality and growth, since such companies may pay dividends sooner or later. If not, be happy about it, because in this case, there is a good chance that the companies are effectively reinvesting the cash they generate.
👆I didn't become a fan of dividend investing, and I won't be after this, but I'm keeping my eyes open and I recommend this to you too: sometimes it works, so why not take advantage of it?
🤑If you are interested in what brokers we use, read our articles below:
(I.e.Interactive Brokers Broker Account Analysis – Professional for Professionals
📈LightYear Brokerage Account Analysis - Simplicity and Cheapness Go Hand in Hand
Frequently Asked Questions about Dividend Investing
Answers to the most common questions
Do you own dividend-paying stocks, or are you just wondering if it's worth building a strategy around? Here you'll find concise answers to the most frequently asked questions: do dividend stocks really outperform, why dividends can reduce returns, how much tax the government takes from it, and when it might still be a good decision to buy a dividend-paying company.
Click on any question and the answer will open. These are intentionally short summaries: if you are interested in the details, I will expand on them in more detail in the appropriate sections of the article. Important: the tax rules and exchange rate data reflect the time of writing of the article.
What is dividend investing and why has it become so popular?
An investment strategy that is based on stocks that pay dividends regularly, preferably increasing them year after year. Its popularity is due to the predictable, growing cash flow, the abundance of studies on the subject, and the very convincing math on paper. Many people also saw dividend stocks as a substitute for bonds. However, since the mid-2010s, growth stocks have taken the market by storm, and many of their former domestic promoters have switched to ETFs.
Do dividend-paying stocks really outperform the market?
It depends on what period you look at. In long periods of recession and falling markets, yes, several studies have shown this. The S&P 500 Dividend Aristocrats index has returned 11.6% per year since its inception in 2005, compared to the S&P 500's 10.6%, but over the last 10 years it has lagged 10.1% vs. 13.0%. According to Hartford Funds, between 1940 and 2025, dividends accounted for only about a third of the S&P 500's total return.
The correct reading, in my opinion, is that companies of better than average quality do not outperform because they pay dividends, but rather they are able to pay dividends because they are of better quality.
Why might a company pay a lot of dividends reduce returns?
Because the money paid out is no longer reinvested in the business. For a sample company with a 15% return on capital, before taxes, over a 20-year period, 100% reinvestment gave an annual return of 15.00%, a 10% payout 14.05%, and a 50% payout only 10.60%. At TBSZ, with a 30% US withholding tax, the two dividend versions deteriorate to 13.89% and 9.83%. The more efficiently the company can reinvest the money, the more expensive the dividend is for the investor.
How much tax is payable on dividends in Hungary?
The withholding tax on American shares is 30%, because there has been no double taxation agreement between the USA and Hungary since 2024. On a normal account, at least 5% personal income tax and 13% SZOCHO are added to this, which can total up to 48%. SZOCHO is only payable up to a certain upper limit of the annual total income, which is HUF 7,747,200 in 2026. On TBSZ, the Hungarian tax portion is not paid upon maturity, but the American 30% is deducted there as well.
In treaty countries, tax deducted abroad can be offset against the Hungarian 15% personal income tax, and there is no SZOCHO on shares listed on EEA exchanges. For comparison: exchange rate gains are taxed at 15% personal income tax, while TBSZ is tax-free at the end of the 5-year term.
What does Dividend Challenger, Contender, Champion, Aristocrat and King mean?
These labels indicate how many consecutive years the company has raised its dividend: Challenger 5–9 years, Contender 10–24 years, Champion 25 years or more, Dividend King 50 years or more. An Aristocrat is also 25 years, but only available to S&P 500 members. The Champions, Contenders, and Challengers list was originally compiled by David Fish and continued by Justin Law on DRiP Investing after his death. The label only measures whether a company has raised its dividend, not how much: a company that raises 3% per year is just as King as one that raises 10%.
Is it worth reinvesting the dividends you receive?
In theory yes, in practice it is difficult to do it effectively with a small portfolio. For quarterly dividends of a few tens of dollars, the brokers' minimal fees can take away several percent of the invested amount. If you wait for the dividend, the opportunity cost is high, and if the company's share price rises in the meantime, you can only buy it back at a higher price. In terms of cost, a better solution may be an ETF containing dividend-paying stocks that automatically reinvests (accumulates) the dividend.
Can a dividend-paying stock be used as a bond substitute?
No. A bond has a face value that you get back at maturity, creditors have stronger rights than shareholders, and its price moves according to a different logic. A stock has no expiration date, and the company can cut or suspend its dividend at any time, as AT&T did. A dividend stock therefore carries equity risk, even if it has a stable payout.
When can it still be a good decision to buy dividend-paying stocks?
After a big market drop, when a good quality company's price took a beating, especially after a dividend cut. Simon Property Group (SPG), bought in 2020 during COVID, rose from an average price of $63.03 to $203.39, and offers a dividend yield of 14.12% on cost. Philip Morris (PM) rose from an average price of $79.06 to $192.78, and offers a dividend yield of 7.44% on cost. In both cases, the majority of the return came from valuation corrections and fundamental performance, with the dividend being just an add-on.
Why is it worth looking at British dividend-paying companies?
Because the UK does not deduct withholding tax from dividends, so on TBSZ, at the end of the 5-year lock-up, the British dividend can be completely tax-free. On a normal account, the Hungarian 15% SZJA and (since the British stock exchange is not an EEA market) the 13% SZOCHO are still payable. Some good quality, dividend-paying British companies worth taking a closer look at are: Games Workshop, Admiral Group, Rightmove, Judges Scientific, Spectra Systems and AJ Bell. However, when choosing, quality and valuation should decide, not dividends.
Legal and liability statement (aka. disclaimer): My articles contain personal opinions, I write them solely for my own entertainment and that of my readers. The articles published here do NOT in any way exhaust the topic of investment advice. What is written here is for informational purposes only and should NOT be construed as an offer. You are SOLELY responsible for the decisions you make.