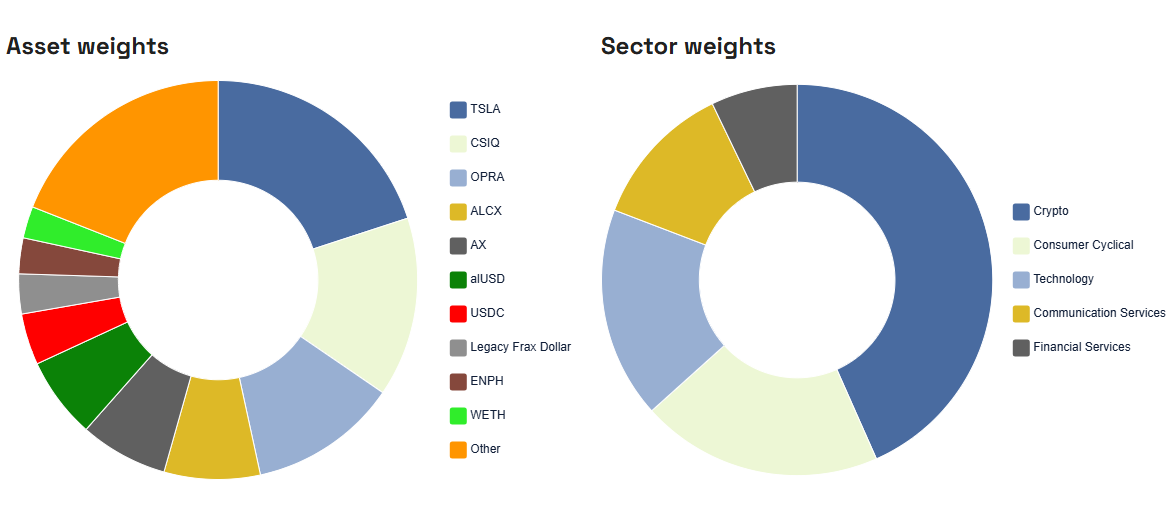
Your Multi-Wallet DeFi and Stock Portfolio Tracker
See your allocations across different sectors, including crypto holdings.
Make sure that you are never overexposed to any sector and re-allocate your holdings accordingly.
For DeFi, see an aggregate value for different tokens, making it possible to understand your exposure to each project/token.
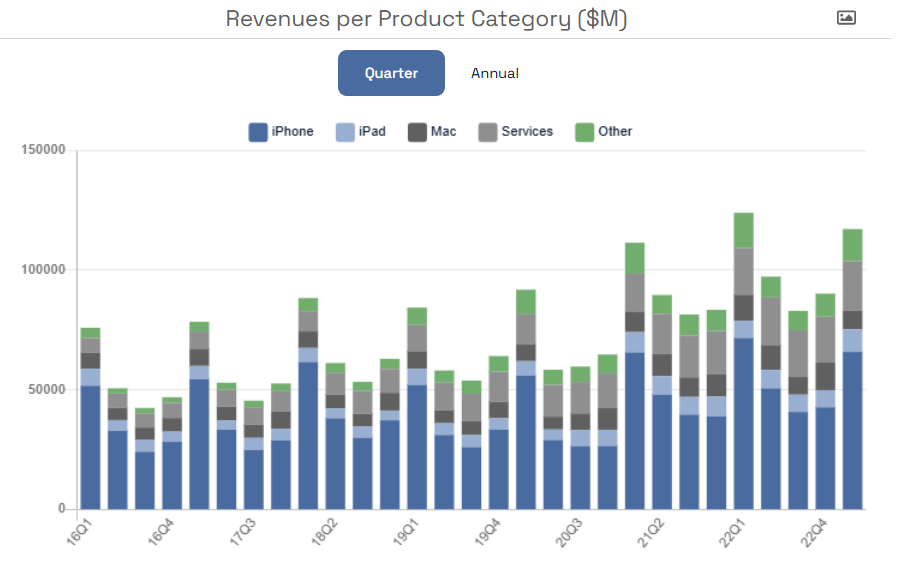
Analyze companies and crypto projects
Gain deeper insight into companies and crypto projects by understanding the fundamental metrics that drive their performance.
Access 20 years of financial data and unique insights into company and project operations.
For dividend paying stocks we have built charts that help you understand how dividend payments have grown over time, if payments are sustainable and how the company is valued compared to the amount of dividends it pays shareholders.
Tip: Try searching for Apple (AAPL) in the searchbox below.
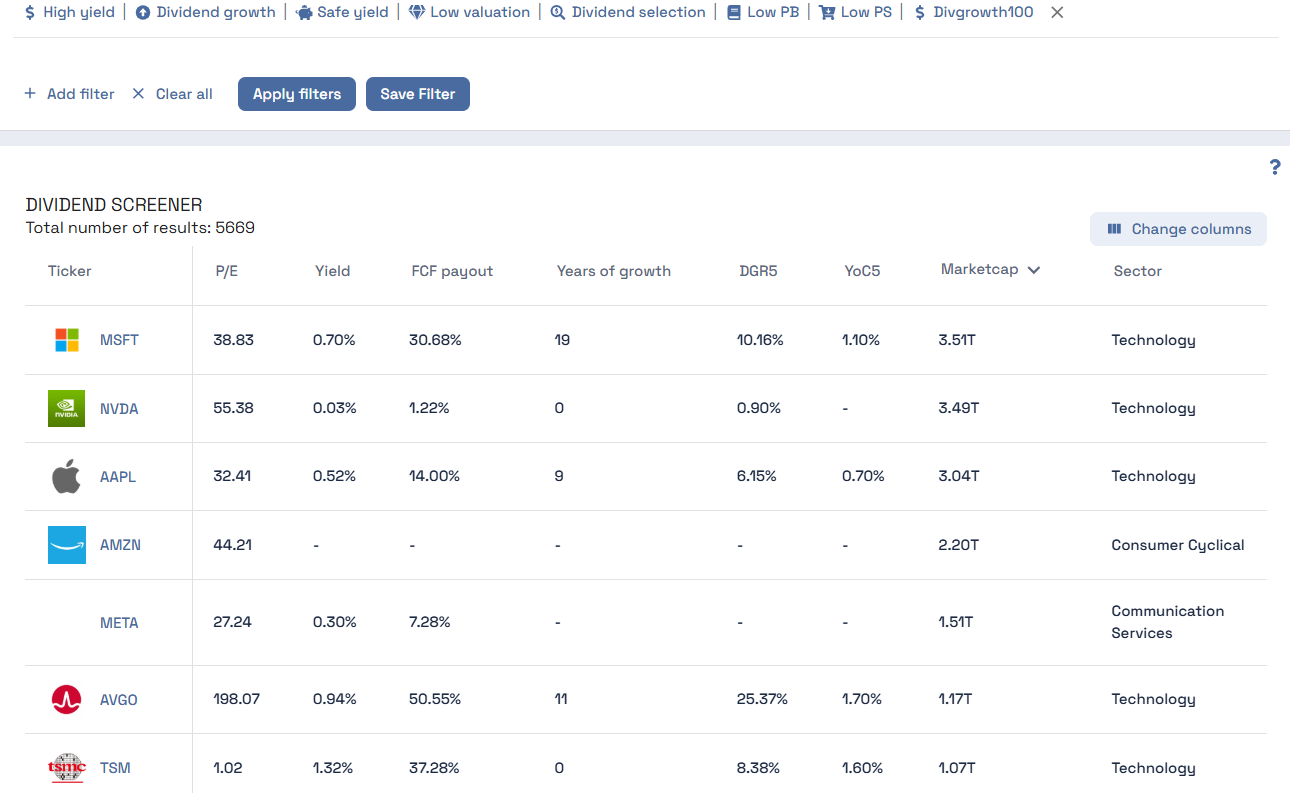
Find promising stocks in the Company Screener
Looking for undervalued companies?
Set up your own parameters, or take a look at our pre-configured lists, which includes:
- Low Valuation
- Dividend Growth
- Safe yield